

How to Analyse Western Blots
Western blots are a key technique where antibodies are used to probe immobilised proteins on a membrane in order to visualise them. Western blots are essential for comparing protein expression between experimental conditions and for working out the molecular weight of proteins.
Measuring the molecular weight of proteins
The molecular weight of a protein can be estimated by comparing the migration of proteins of known molecular weight (such as in a protein ladder) and the target protein. A general procedure for doing this is:
- Run the gel using a molecular weight ladder, transfer to the membrane and then visualise the proteins using a dye such as Coomassie blue or Ponceau.
- Calculate the relative migration distance (Rf) of each protein standard and the target protein using the equation below. This can either be measured using a ruler or within appropriate software.

- Plot the log(MW) of the protein standards against relative migration distance (Rf) on a graph and generate a curve of best fit. This should be linear if the samples are fully denatured and the gel percentage was adequate for sufficient separation.
- Use the equation of the best fit line to calculate the mass of the target using its Rf. The general equation is: which in figure 1 simplifies to:
- The actual protein molecular weight as determined by mass spectrometry is likely to differ from the estimated through western blotting due to differences in glycosylation status, experimental inaccuracies and some proteins not being amenable to full denaturation by SDS.

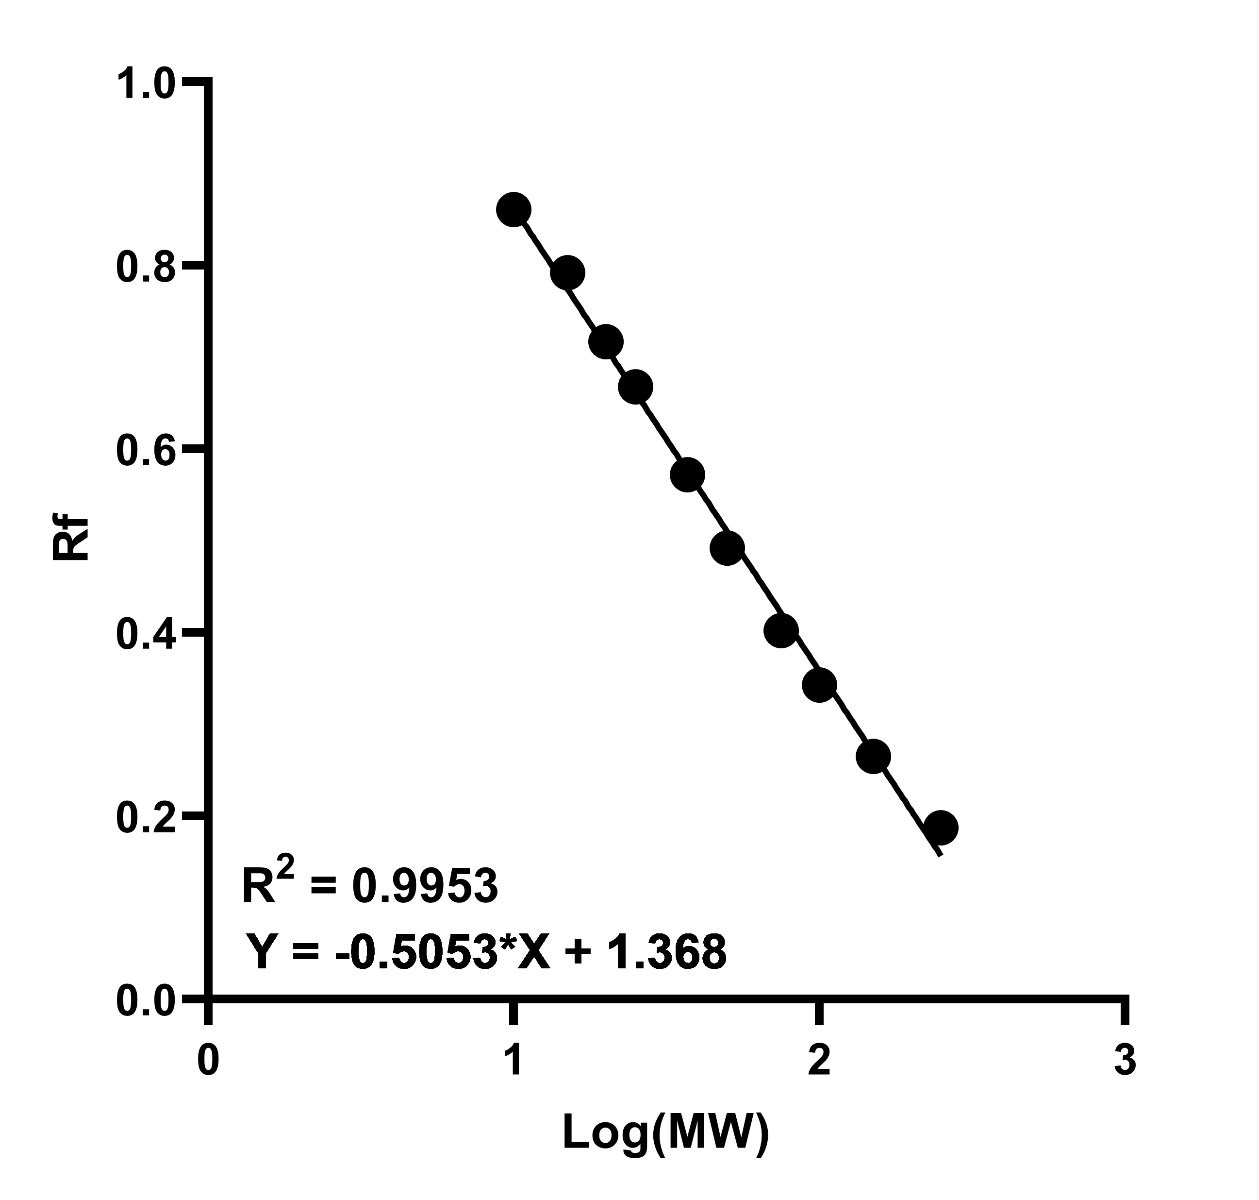
Figure 1. Example standard curve of log(MW) against relative migration (Rf). A high R2 value indicates increased accuracy in interpretation of the unknown proteins MW.
How to quantify protein expression from a Western blot
Protein expression can be quantitatively compared within a immunoblot using densitometry. Crucially this technique can only inform of relative changes in abundance between samples therefore without known standards, cannot be used to give exact concentrations.
- Before trying to take any quantitative measurements it is critical to make sure that the signal is not saturated and is in its linear range (figure 2). If the signal is saturated then it isn’t possible to accurately compare different protein abundances. However, saturation is a relatively easy problem to solve as by reducing the exposure time this can be avoided. However, where there are large differences in protein abundance between samples then it may be necessary to re-attempt the western blot with more similar protein concentrations if it isn’t possible to have both bands properly exposed (i.e. one is always saturated to see the other). Reducing the concentration of primary antibody is also another way of reducing saturation.
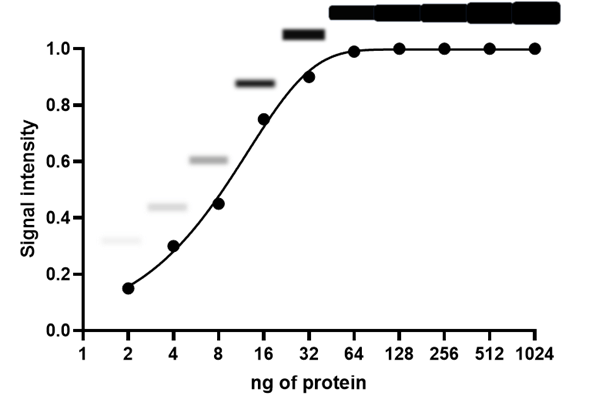
Figure 2: Example curve showing the saturation of western blot signal at high levels of bound protein. Above each datapoint is a representative illustration of the band seen. Adapted from Bell, 2016. BMC Biol; 14:116.
- It is next important to subtract any background noise from the image. Differences in background across the blot may not be consistent leading to changes in band darkness that are influenced by background, not signal intensity. This step is easily achieved in both bespoke analysis software and freeware such as ImageJ (https://imagej.nih.gov/).
- Next it is critical to normalise the signal intensity for protein loading. Naturally each lane will have a slightly different amount of protein in it therefore by normalising to expression of stably expressed “housekeeping” proteins such as GAPDH or β-actin this can help to ensure that any changes in expression of a target protein are not just due to differences in loading. It is important when designing the experiment to think about whether the manipulation might affect expression of the loading control and another issue is that due to high expression it is often difficult to capture them in their linear range.
- Finally it is important to subject results to the appropriate statistical tests for the experimental design. It should be planned before the experiment was carried out what n-number was needed to achieve a sufficient statistical power (often chosen as 0.8).
Further Reading
Bell, 2016. Quantifying western blots: none more black. BMC Biology; 114: 116. Doi: 10.1186/s12915-016-0339-1
Gassmann et al, 2009. Quantifying Western blots: Pitfalls of densitometry. Electrophoresis 2009; 30: 1845-1855. Doi: 10.1002/elps.200800720
Pillai-Kastoori et al, 2020. A systematic approach to quantitative Western blot analysis. Analytical Biochemistry; 593: 113608. Doi: 10.1016/j.ab.2020.113608